ADMINS
Kenton Ngo
Johnny Camacho
Aimee Fausser
EDITORS
Bryan Scrafford

BlogRoll
STATEWIDE
Bearing Drift
Blue Commonwealth
BlogNetNews
CobaltVA
Not Larry Sabato
Raising Moran
VAPoliticalBlogs

NORTHERN
7 West
Albo Must Go
Anonymous Is A Woman
Anti-BVBL
Blacknell
Blueweeds
Getting Around
Leslie Byrne
Left of the Hill
Ox Road South
Raw Fisher
Renaissance Ruminations
The Green Miles
Too Conservative
X Curmudgeon

HAMPTON ROADS
Shad Plank
VBDems
Vivian Paige

CHARLOTTESVILLE
Democratic Central
Rick Sincere
Rule .303
Shaun Kenney
Waldo Jaquith

RICHMOND
SlantBlog
Save Richmond
Tertium Quids

SOUTHSIDE
Dem Bones
What IS Right For Virginia
220 South

VALLEY
Adam Sharp
RockDem
The Friendly City
The Valley Progress Report

SOUTHWEST
Rick Howell Speaks
Star City Harbinger

MAP: High School Dropout Rates Around the State

by: Kenton Ngo

Wed Apr 01, 2009 at 01:23:28 PM EDT


dropouts copy

As always, click to embiggen.

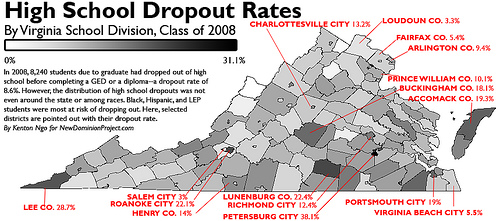
The Virginia Department of Education released graduation data for the Class of 2008 yesterday. The vast disparity between counties like Fairfax, where 1 out of every 20 students dropped out, and cities like Petersburg, where nearly 8 out of every 20 dropped out, could not be starker. Even among next door neighbors there were sharp differences. In Salem, 3% dropped out. In neighboring Roanoke, 22% dropped out.

Full data set available here.

Kenton Ngo :: MAP: High School Dropout Rates Around the State
Tags: (All Tags)
Print Friendly View Send As Email
Va's announced drop out rates are grossly understated because they ignore kids who stop
school before senior year.

As most kids turn 16 in sophomore year, drop out rates start that year as kids are able to get a driver's license and work once they're 16.

I strongly suspect that, measured against enrollment as of the end of freshman year, drop-out rates would be double or more the figures shown on the chart.


No they don't.
These data specifically compare 2008 graduation against the 2004 incoming freshman cohort.

[ Parent ]
where does it say that DOE is comparing incoming 2004 with graduating 2008
because that would be a change in reporting.

[ Parent ]
found the description I was looking for & noticed another 2% that DOE who've left
school and cannot be accounted for: so drop out rate may actually be >10%.

[ Parent ]
Recent Diaries

Menu

Make a New Account

Username:

Password:


Forget your username or password?


Syndicate
RSS 2.0

EMAIL
Send tips & press releases to:
[email protected]

NDP HOUSE RANKINGS
1. 52 OPEN (R)
2. 42 Albo (R)
3. 86 Rust (R)
4. 34 Vanderhye (D)
5. 50 Miller (R)
Full rankings
Updated: April 17

Search


Advanced Search


LeftyBlogs Latest

The views expressed on this site are representative solely of the author, and do not necessarily imply endorsement by New Dominion Project staff.
Powered by: SoapBlox